Widget creation
Creating widgets on the dashboard involves a four-step configuration process. By navigating through these configuration steps, users can design widgets that meet their specific requirements.
Widget configuration
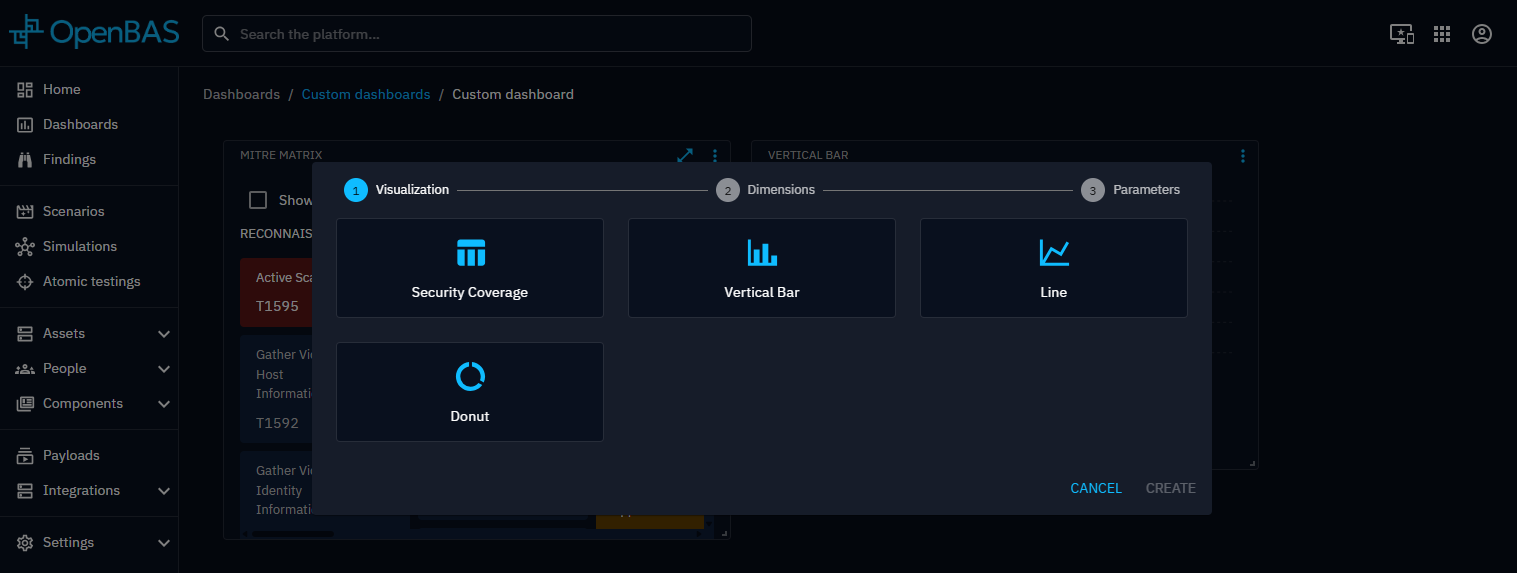
1. Visualization
Start by selecting a visualization type that best represents the data you want to display. The visualization choice determines which dimensions and parameters are available, so it’s important to pick one that aligns with the insights you're aiming to uncover.
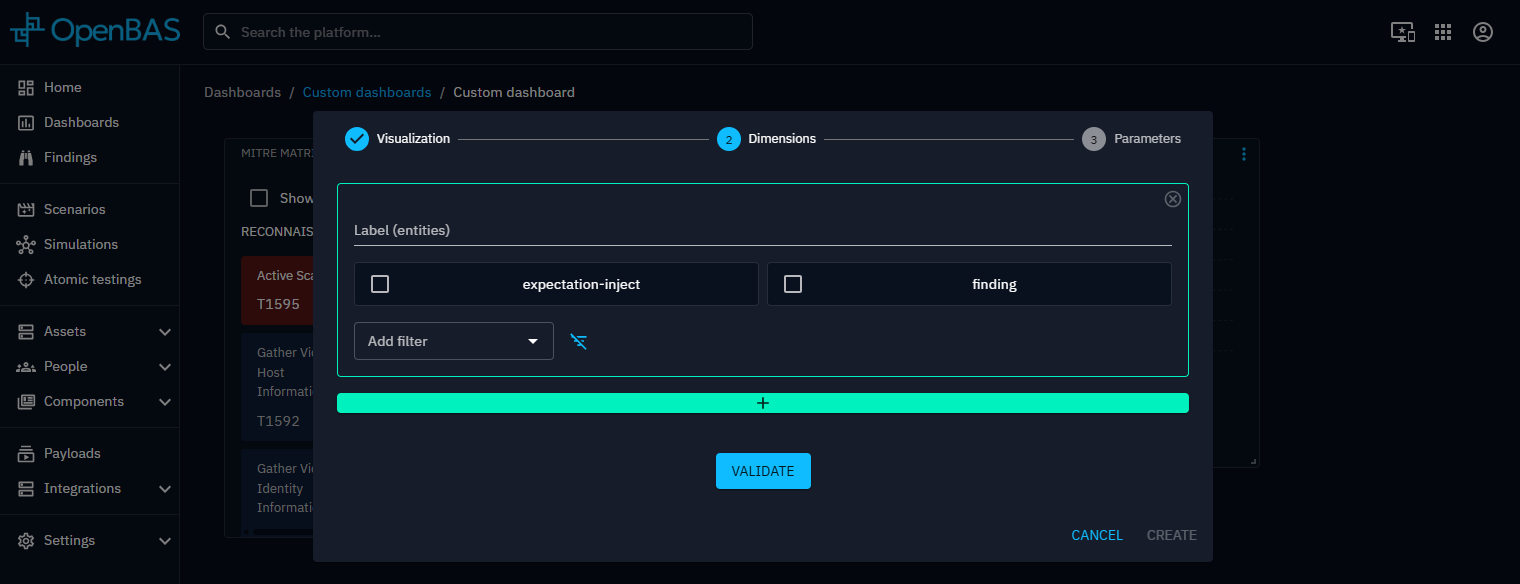
2. Dimensions
Dimensions are determined by the selected perspective and define the dataset used by the widget. You can also apply filters to refine the data and focus the analysis on specific subsets.
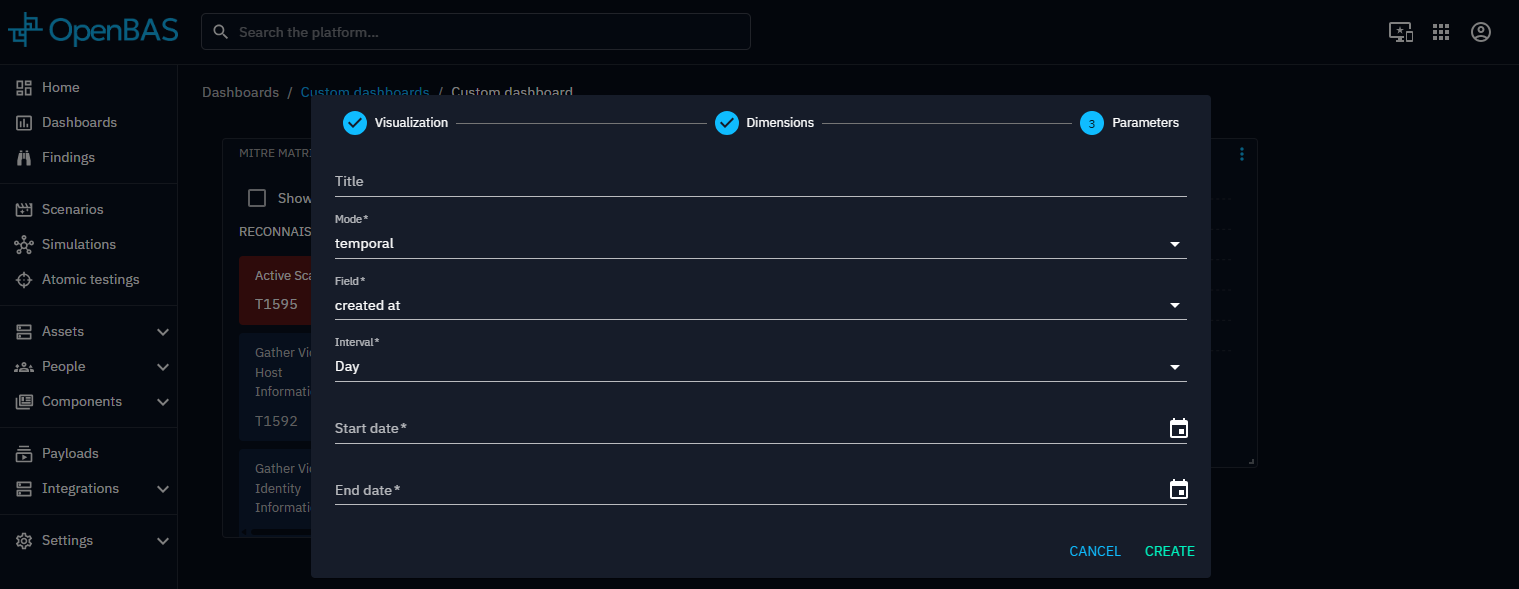
3. Parameters
Parameters allow further customization of your widget. Based on the selected visualization, you can:
- Set the widget title
- Choose which elements to display from the filtered dataset
- Select the data reference date
- Configure additional settings specific to each visualization type
Two mode are available:
-
Structural: projects your data based on a structural property
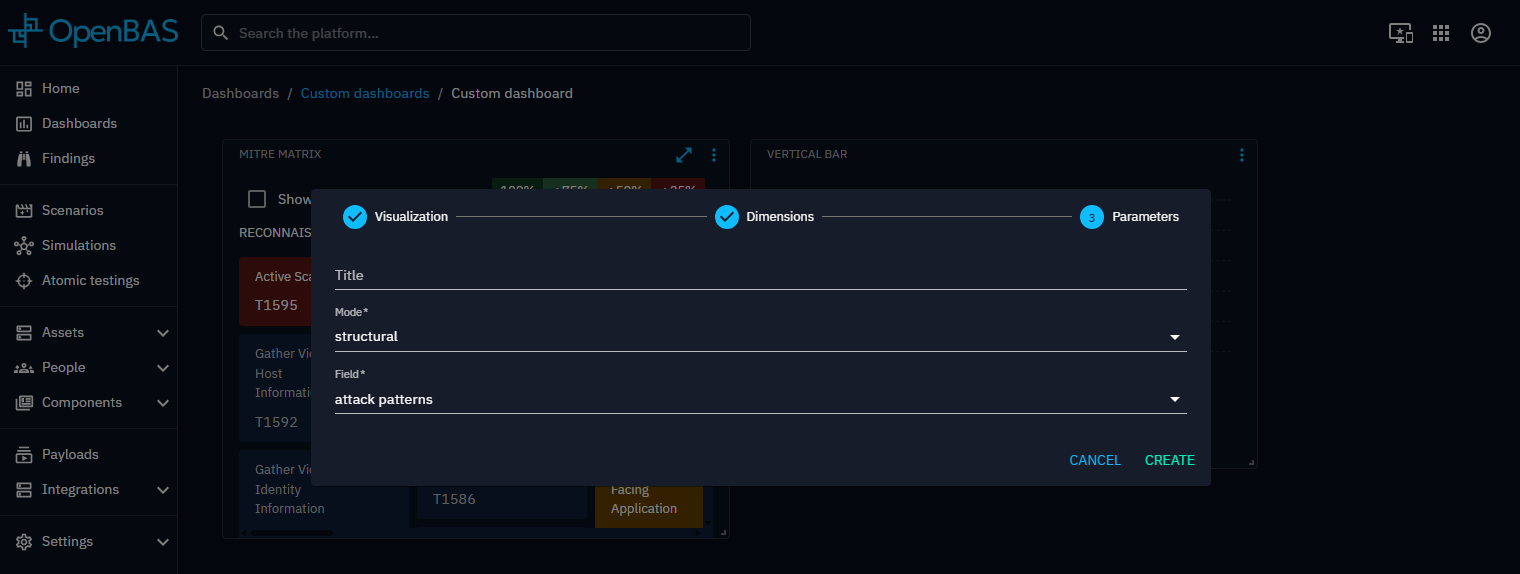
-
Temporal: projects your data based on a temporal property