Atomic testing
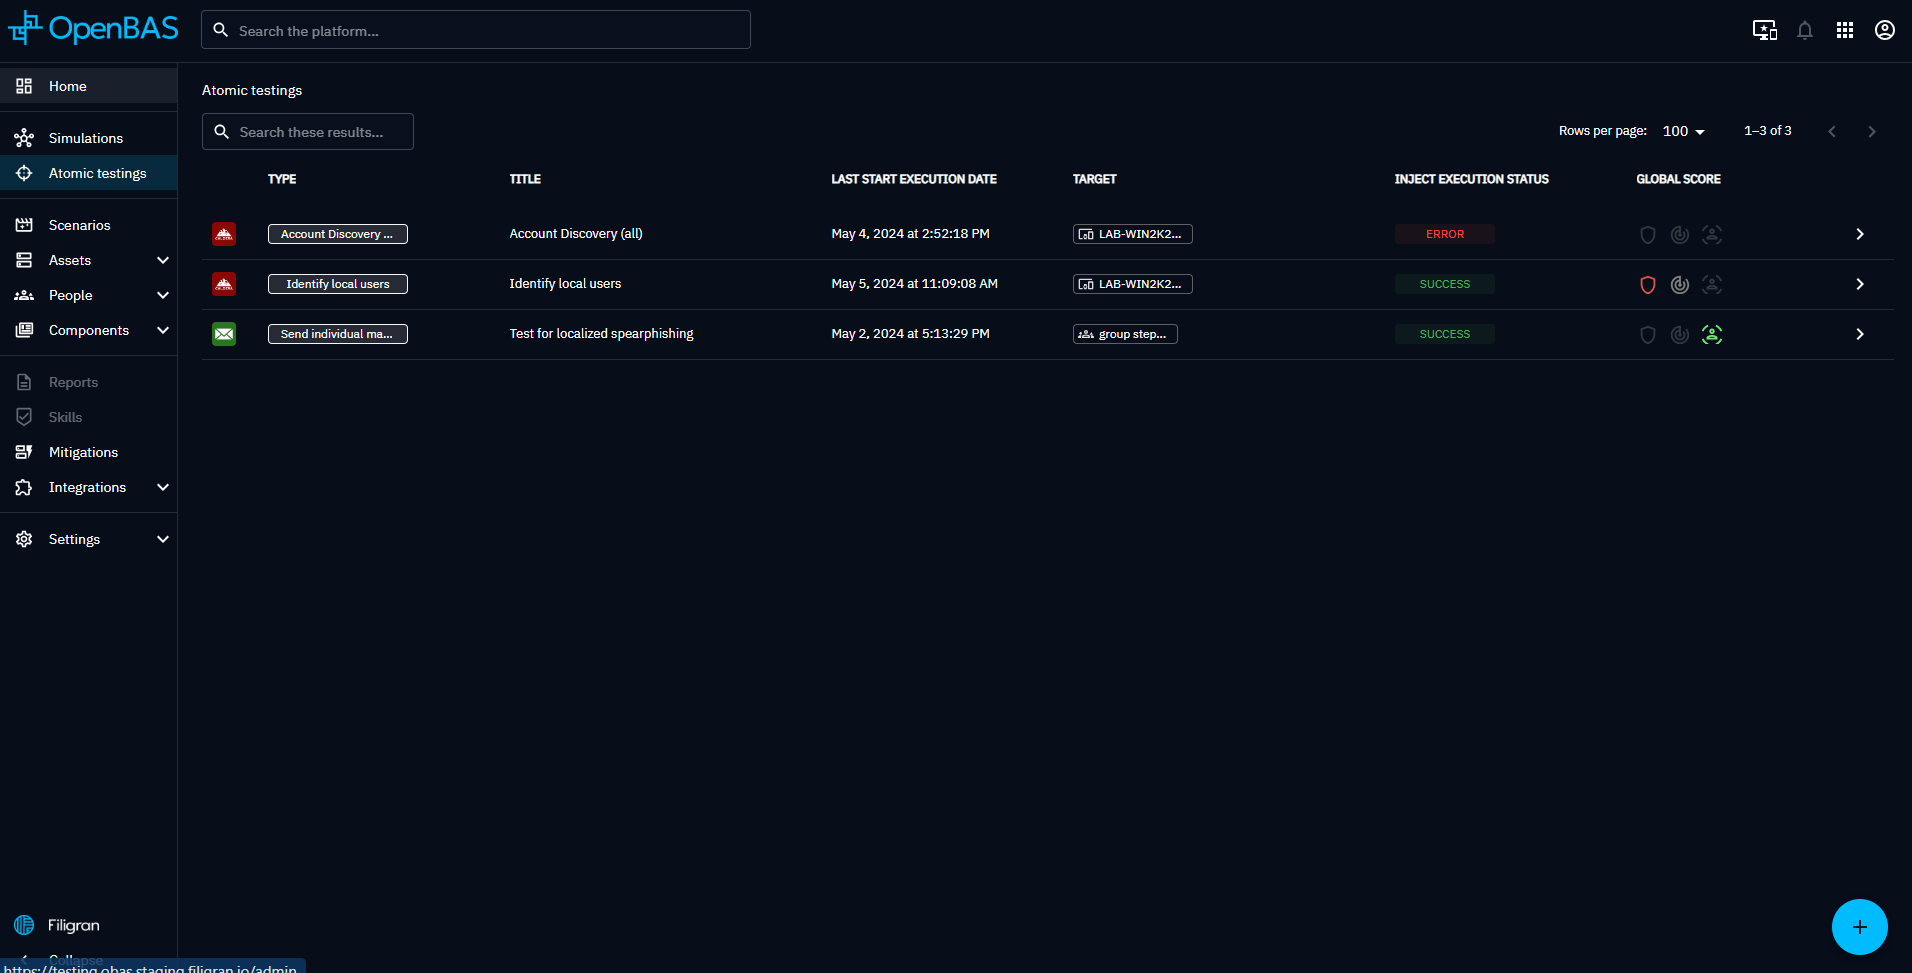
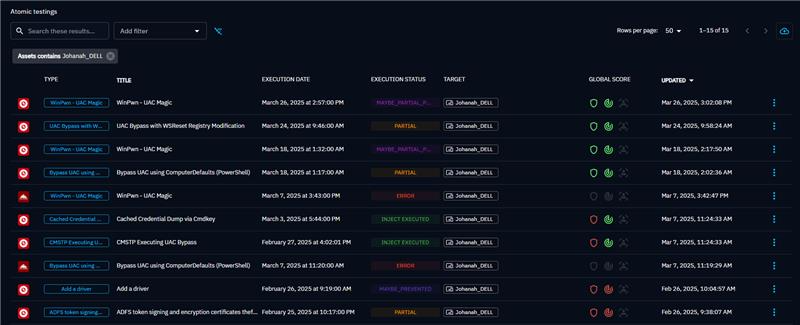
When clicking on Atomic testing in the left menu, you access to the list of all atomic testings ever launched in the platform.
Atomic testing is a great way to simulate a singular attack technique you are particulary interested in, and test immediately your capability to prevent and detect it.
The presented list allows you to easily see global scores of all your recent atomic testings.
Search the list
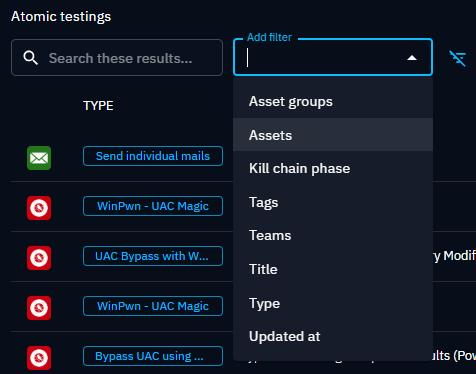
You can search the list using the name or one the filters. Here are the available filters for this list.
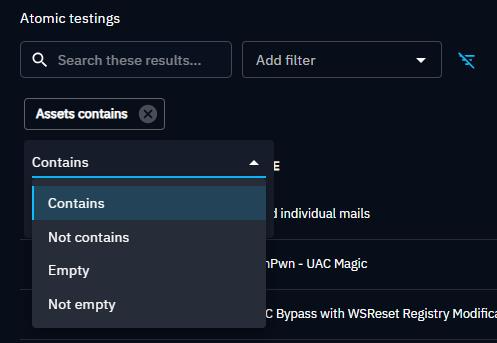
Once you choose the attribute you want to apply a filter on, you can choose the operator.
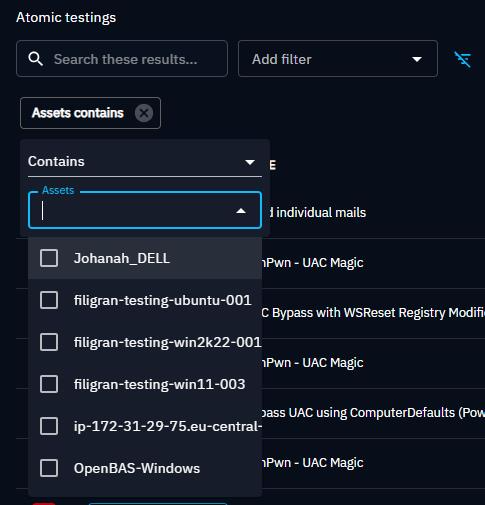
Then you have the list of values for the attributes you choose.
Here is the list once you apply the filter.
Create an Atomic testing
An atomic testing is essentially the simulation of a single inject, against a selection of targets (Players, Teams, Assets, Assets Group) with assorted expectations.
By clicking on the + button at the bottom right of the screen, you enter the atomic testing creation workflow.
On the left of the creation screen is the list of all available Inject you can play for atomic testing. Logos on the left of each line indicates which Injector is associated with each inject.
Depending on your integrations, this list can be long. You can filter the list by kill chain phase, injector, compatible platforms or Mitre Att&ck tactics.By clicking on the "Att&CK" logo near the search bar, you can also filter by selecting a precise Mitre Att&ck techniques.
When selecting an inject on the left, the form on the right populates itself with a by-default title and propose you to define when the inject should be played after the launch of the atomic testing. You can keep it to 0.
By clicking on Inject content, you can define now or later the targeted assets or players, needed configurations, and the assorted expectations.
The "available variables" button helps you to use already defined variables into compatible fields.
Atomic testing screens
Details of an Atomic testing is composed of three parts:
- A header with the title, a tooltip showing details about the inject (status, tags, and description), pie charts summarizing the results, and actions like launch, update, delete, and export.
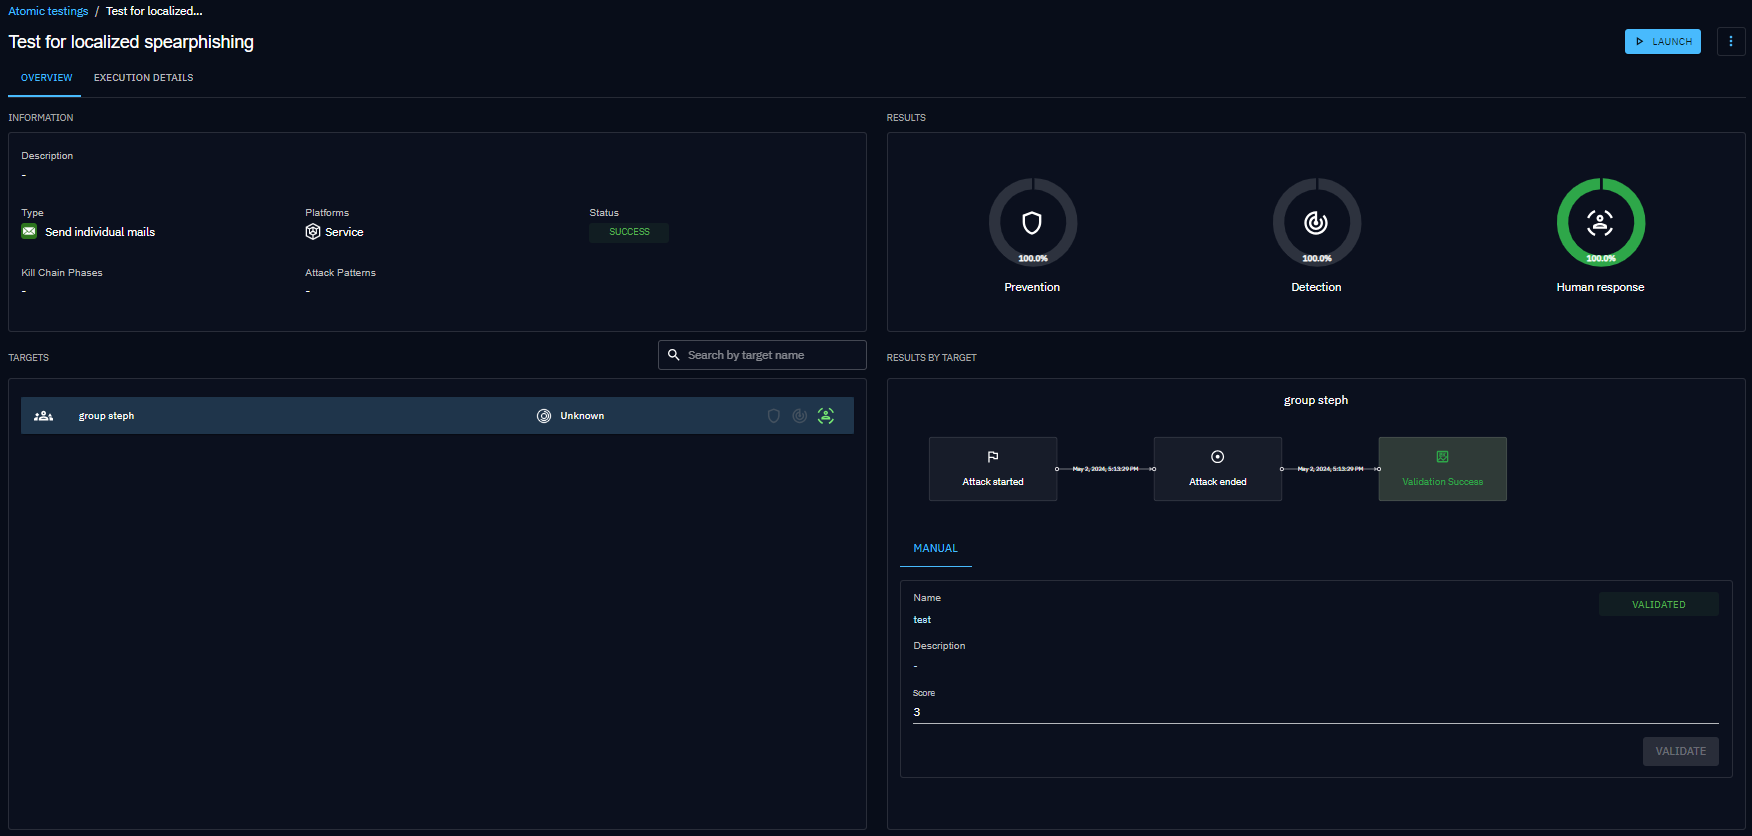
- An overview screen that gives a quick summary of test results across all targets.
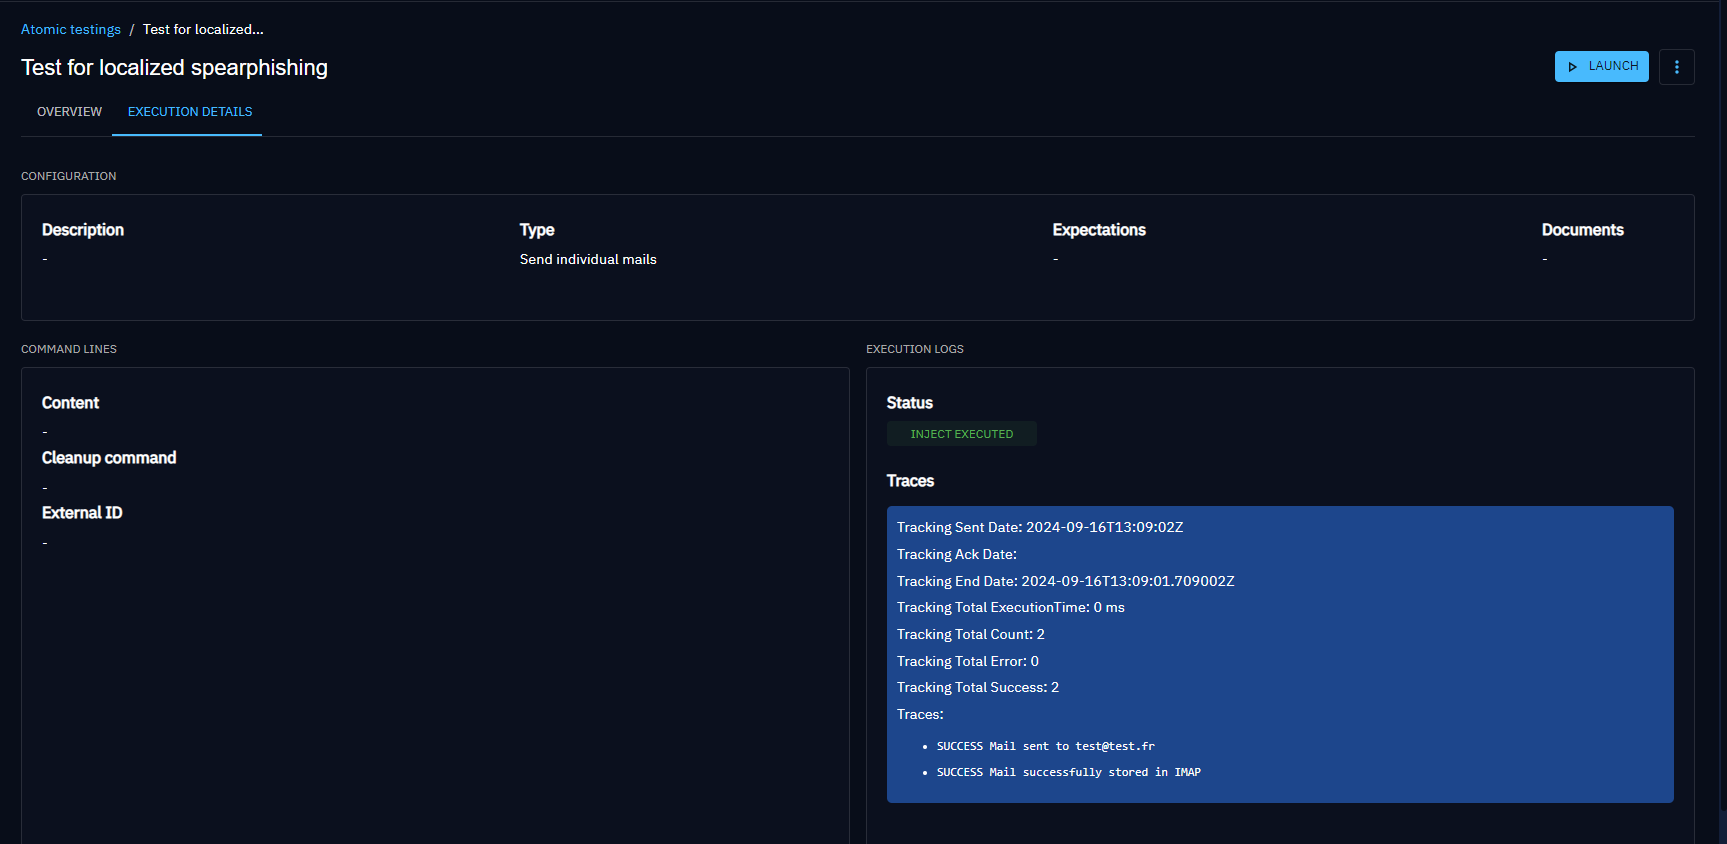
- An execution details screen that shows test expectations and detailed execution traces.
Overview
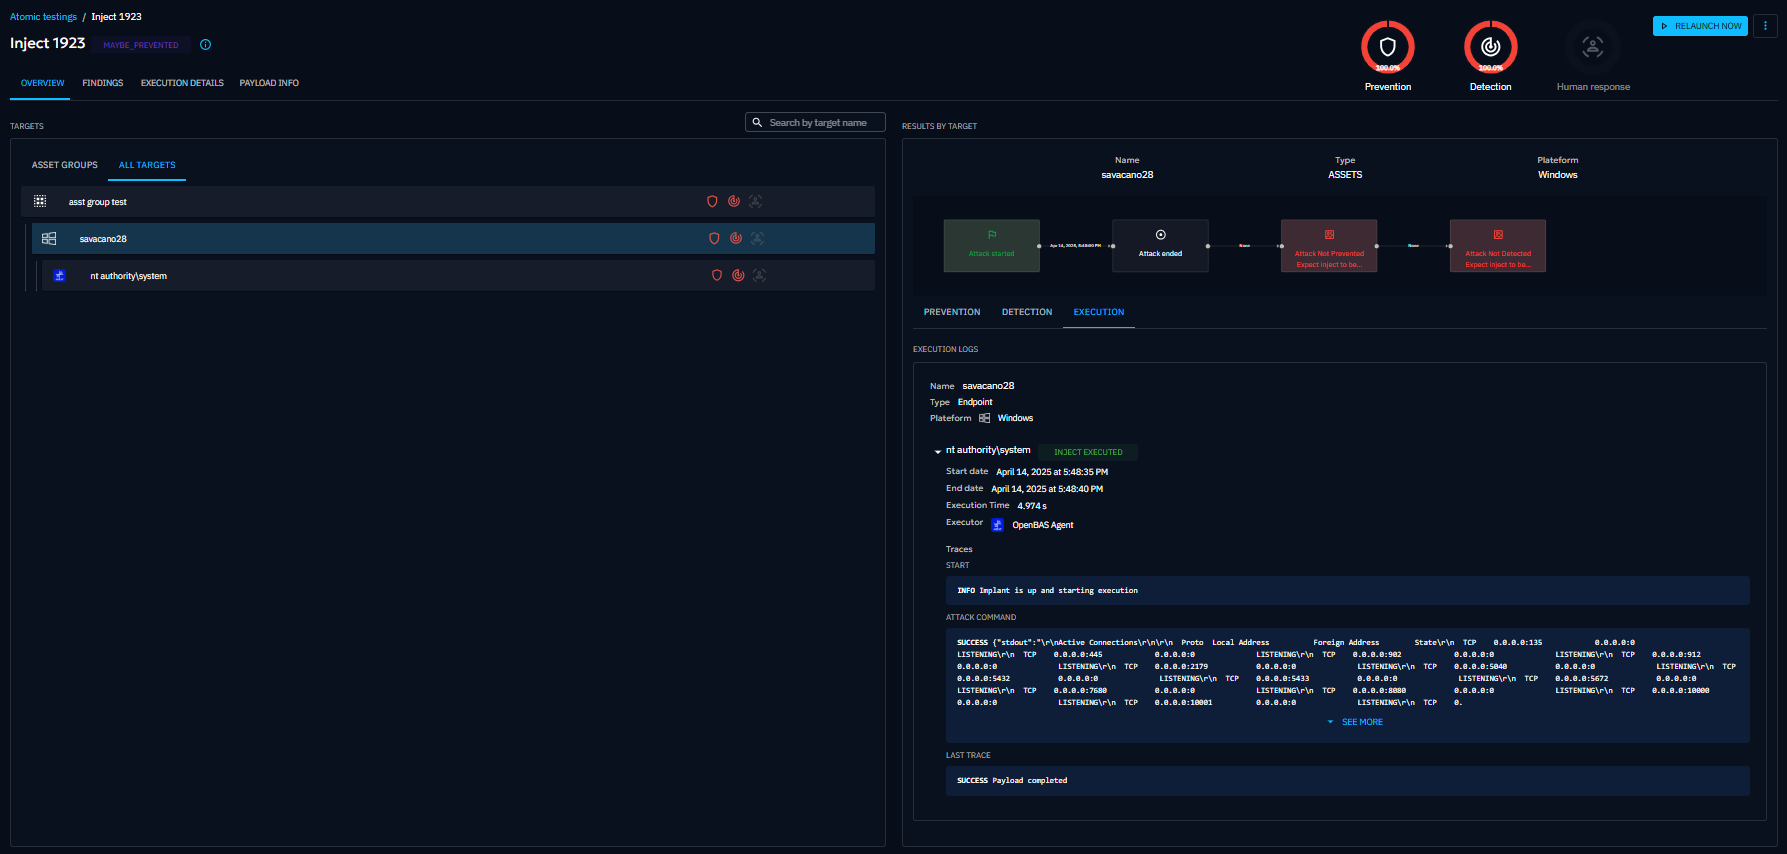
The first screen displayed when you click on a specific Atomic testing from the list is a breakdown of your security posture against this test.
As for Simulation and Scenario, Results are broken down into:
- Prevention: the ability of your security posture to prevent the inject
- Detection: the ability of your security posture to detect the inject
- Human response: the ability of your security teams to react as intented facing the inject
At the top, big metrics summarize how all targets performed. On the left, a list of targets lets you quickly check results for each one. When you select a target, the right side shows a timeline of the test and its results, including execution logs.
Findings
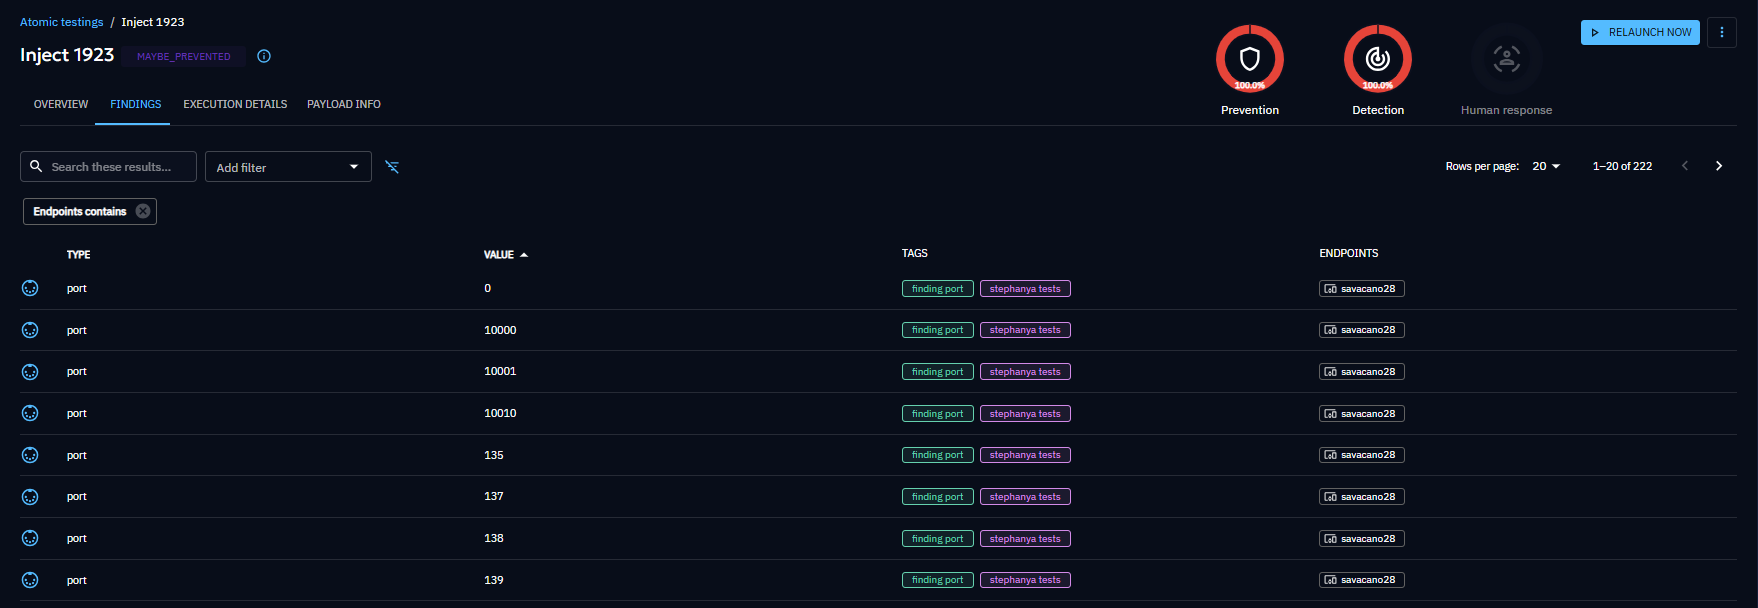
The Findings screen displays what was detected during the inject, based on the output parser in the payload. You can filter findings by name, type, creation date, target, value, or tag.
Execution details
This screen shows the full trace of the inject’s execution, including logs and status information.
Payload info
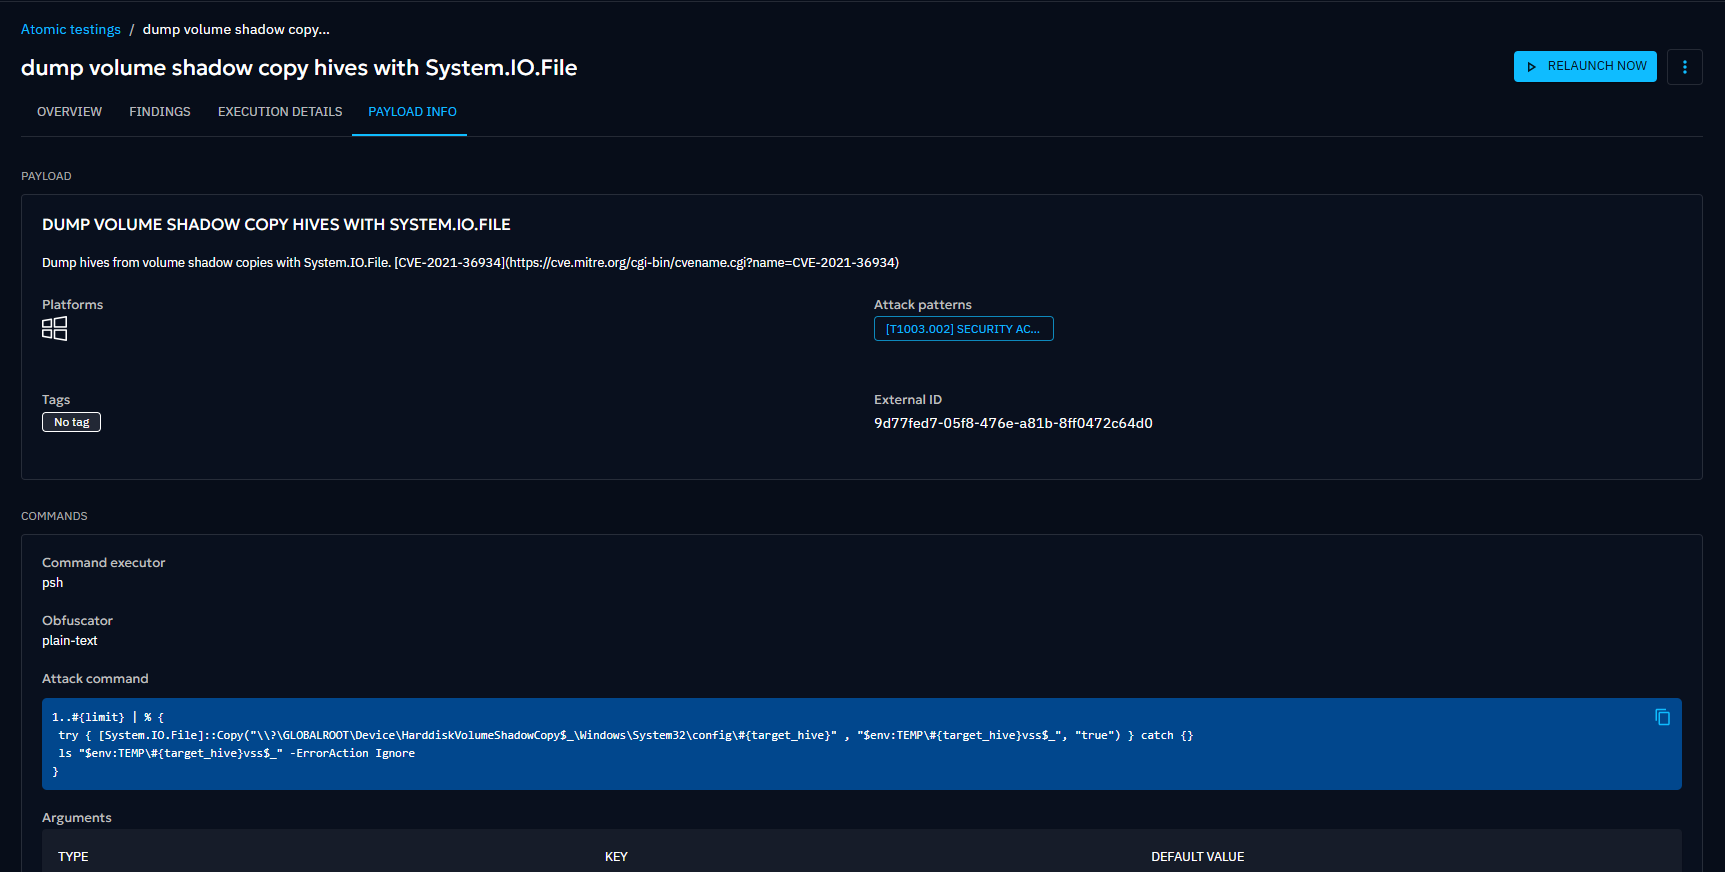
This screen is available for technical injects only. You can see the details of the payload related to the test.
